Spatially Interpolated Data on Ethnicity - SIDE
Carl Müller-CreponPhilipp Hunziker
 |
 |
 |
Description
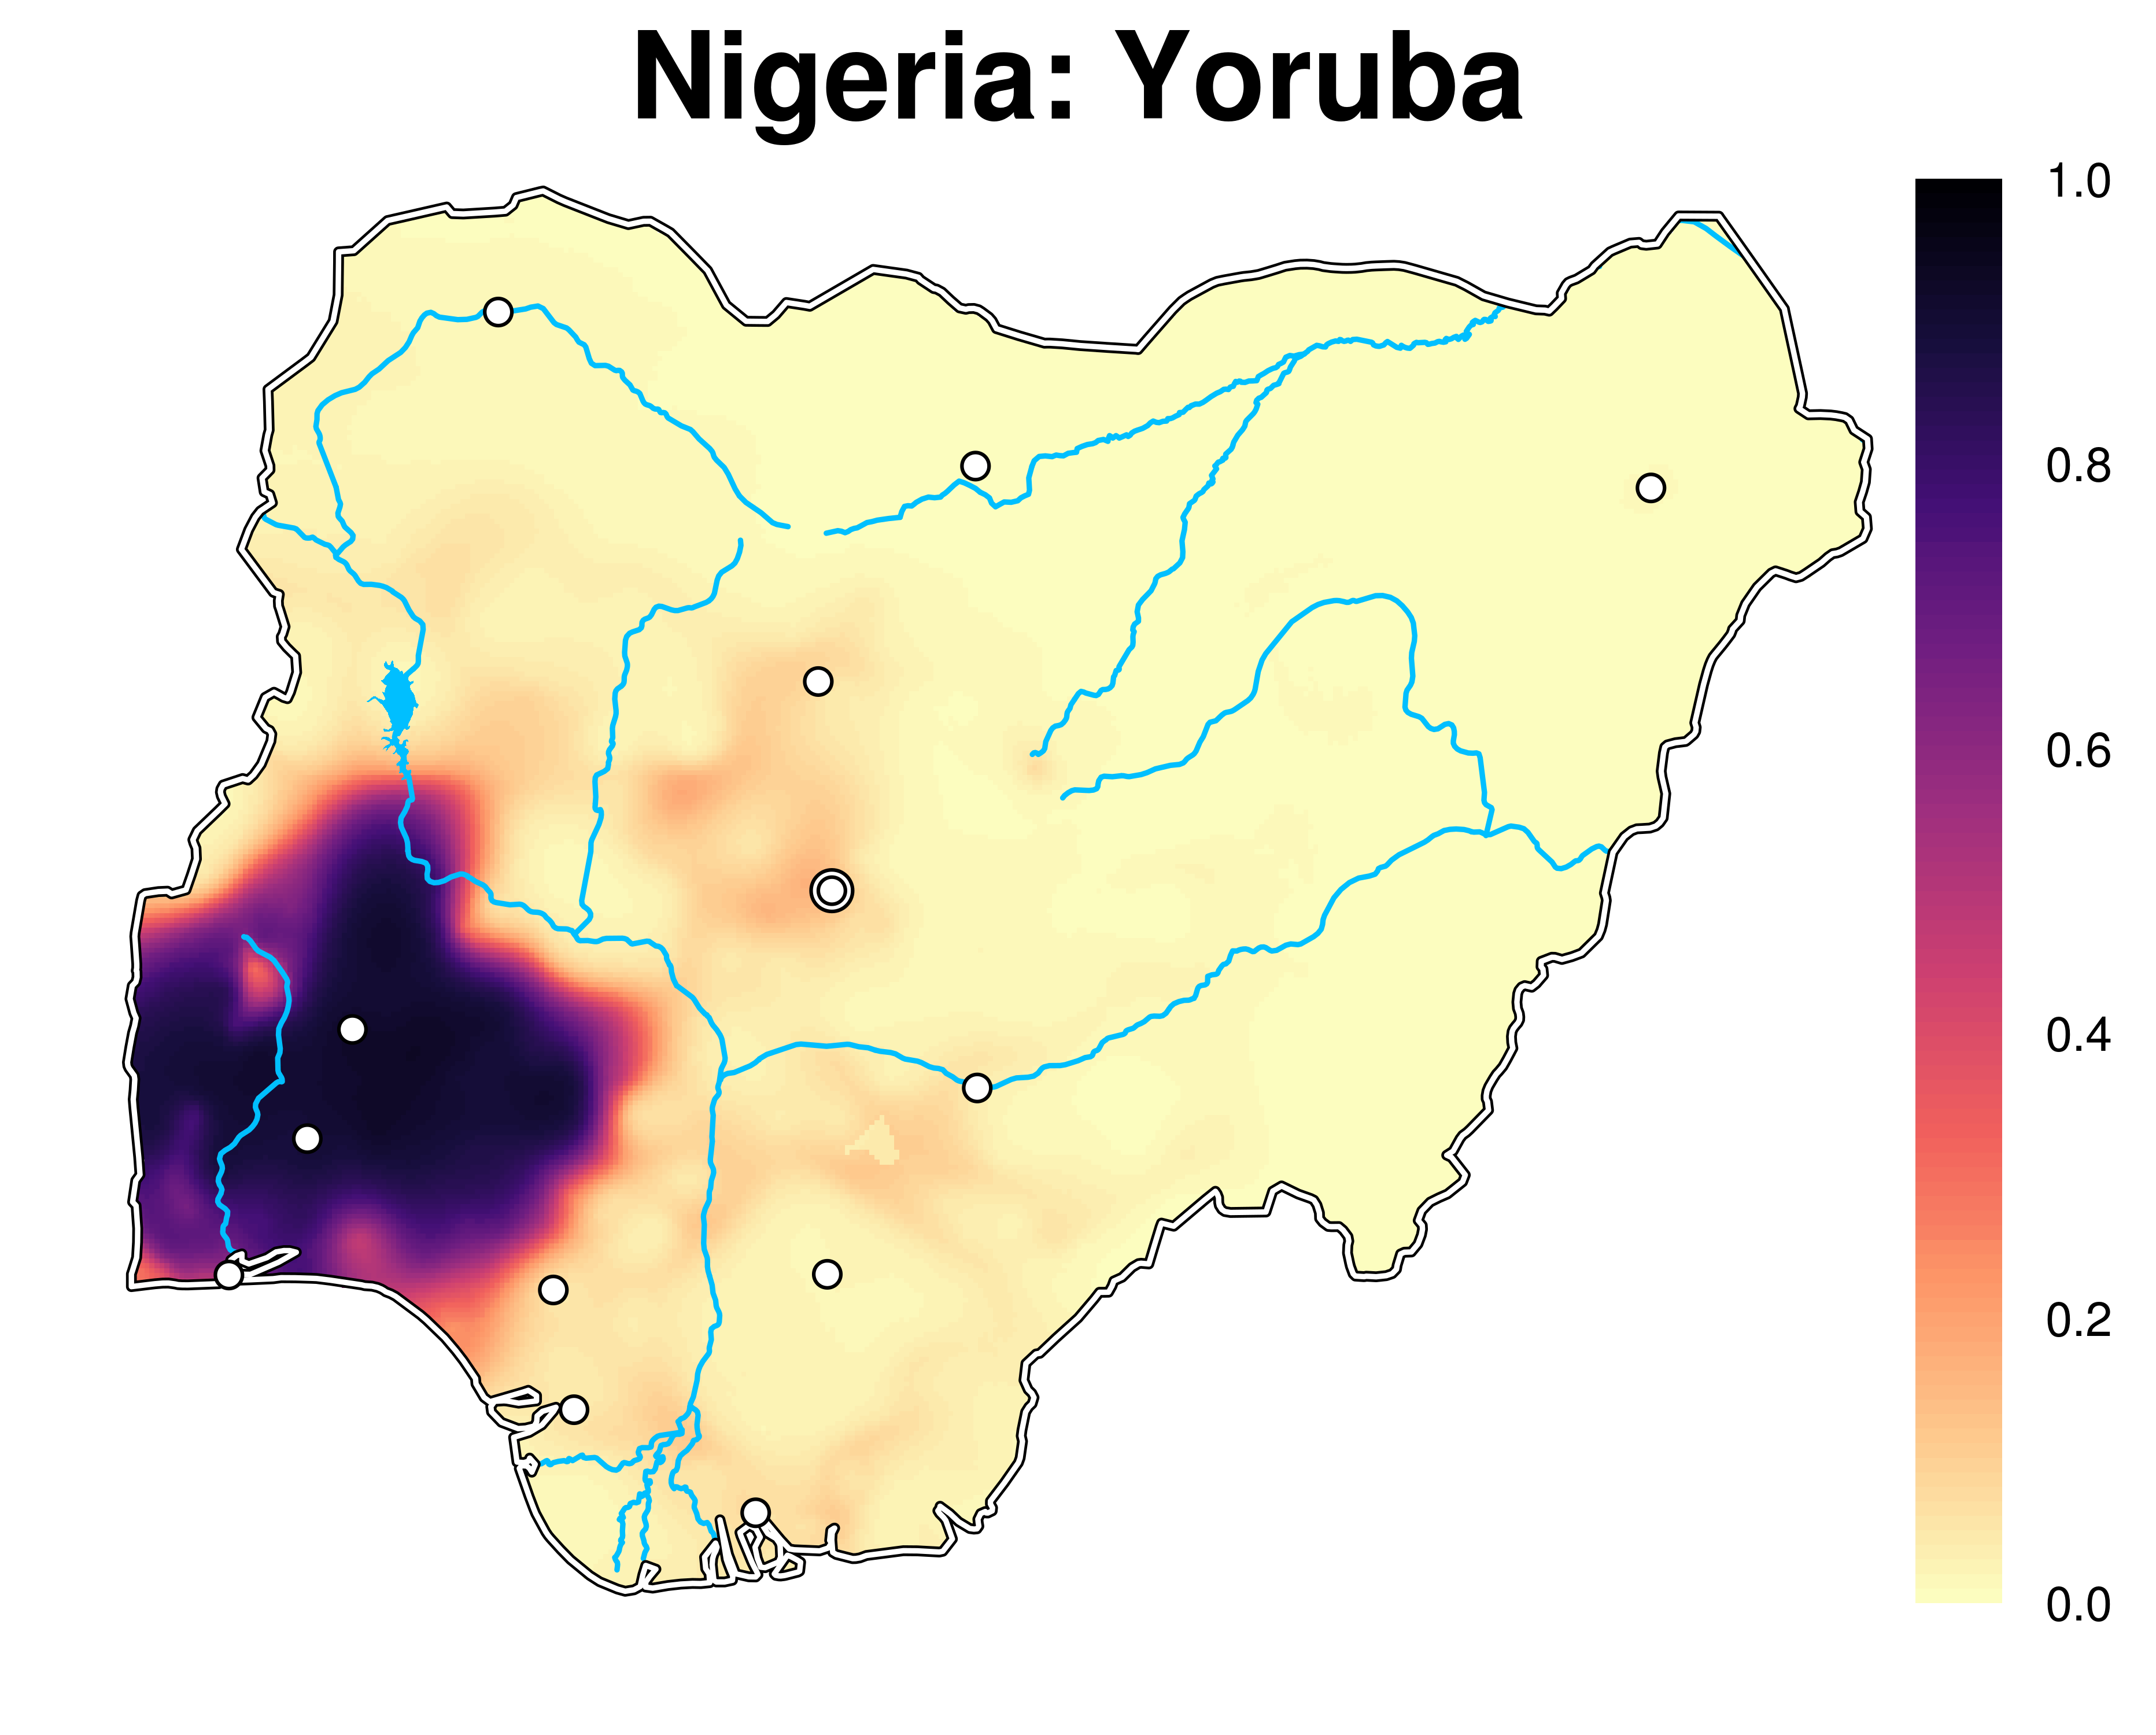
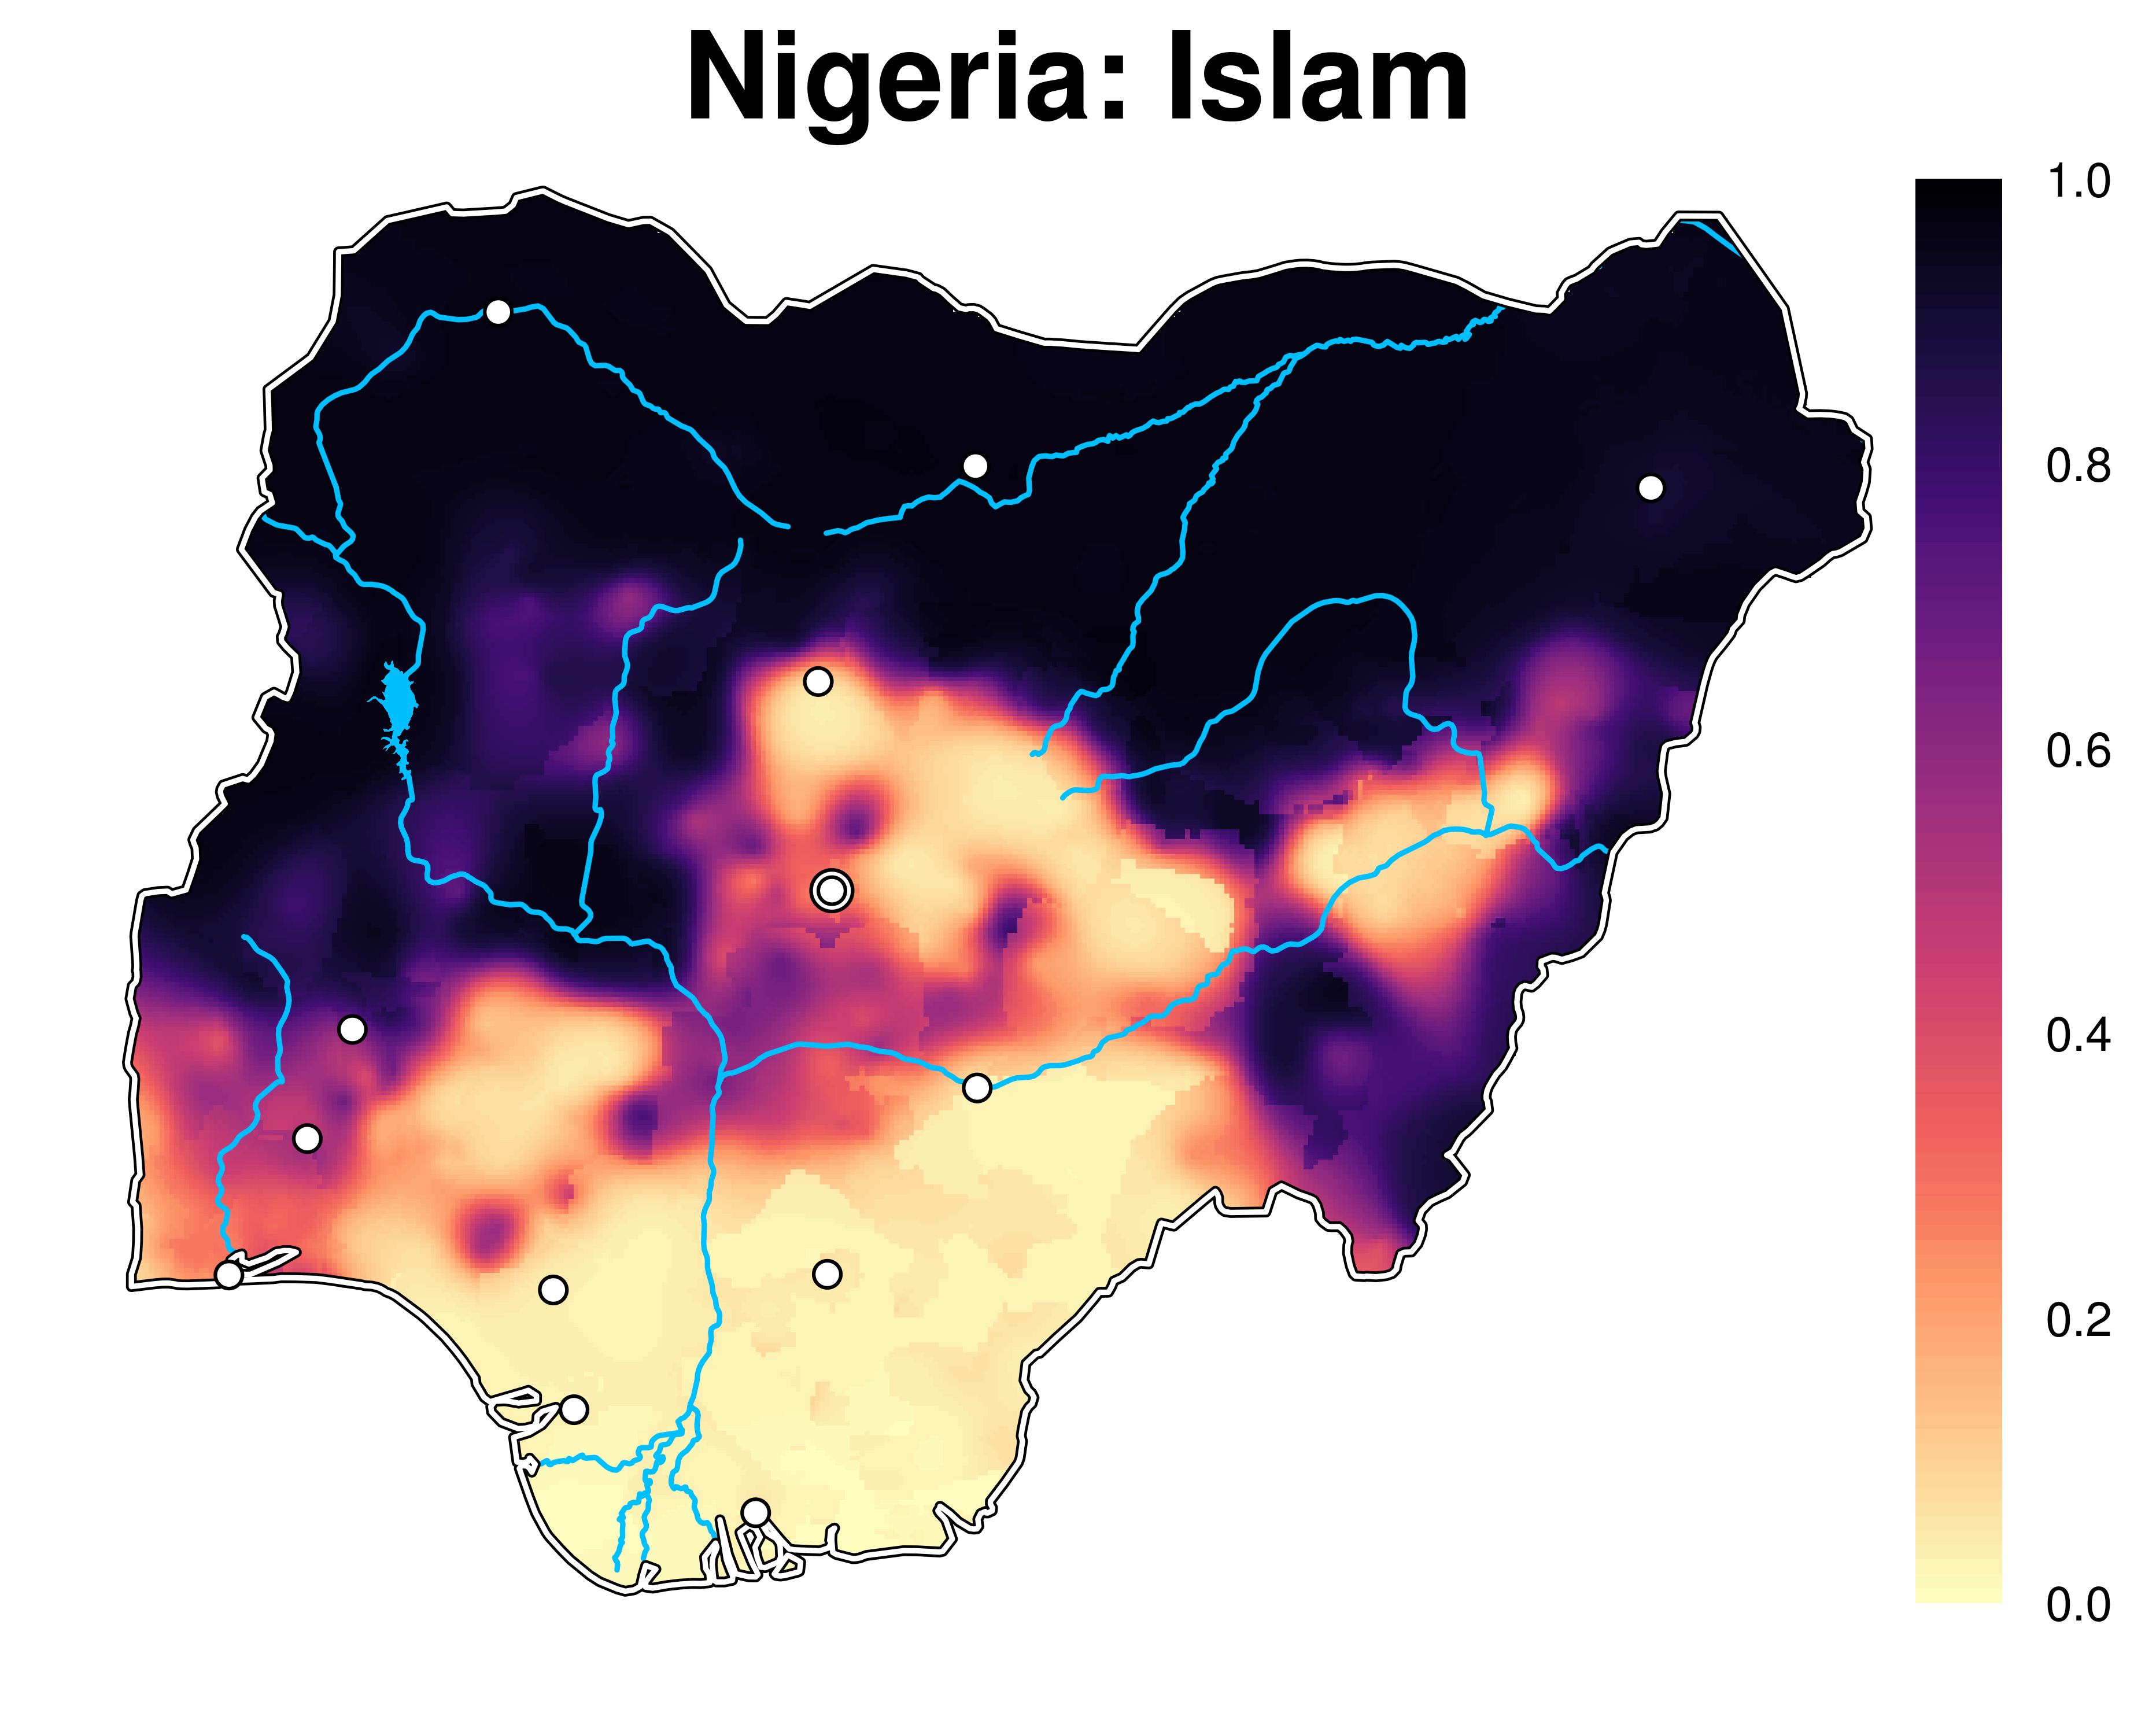
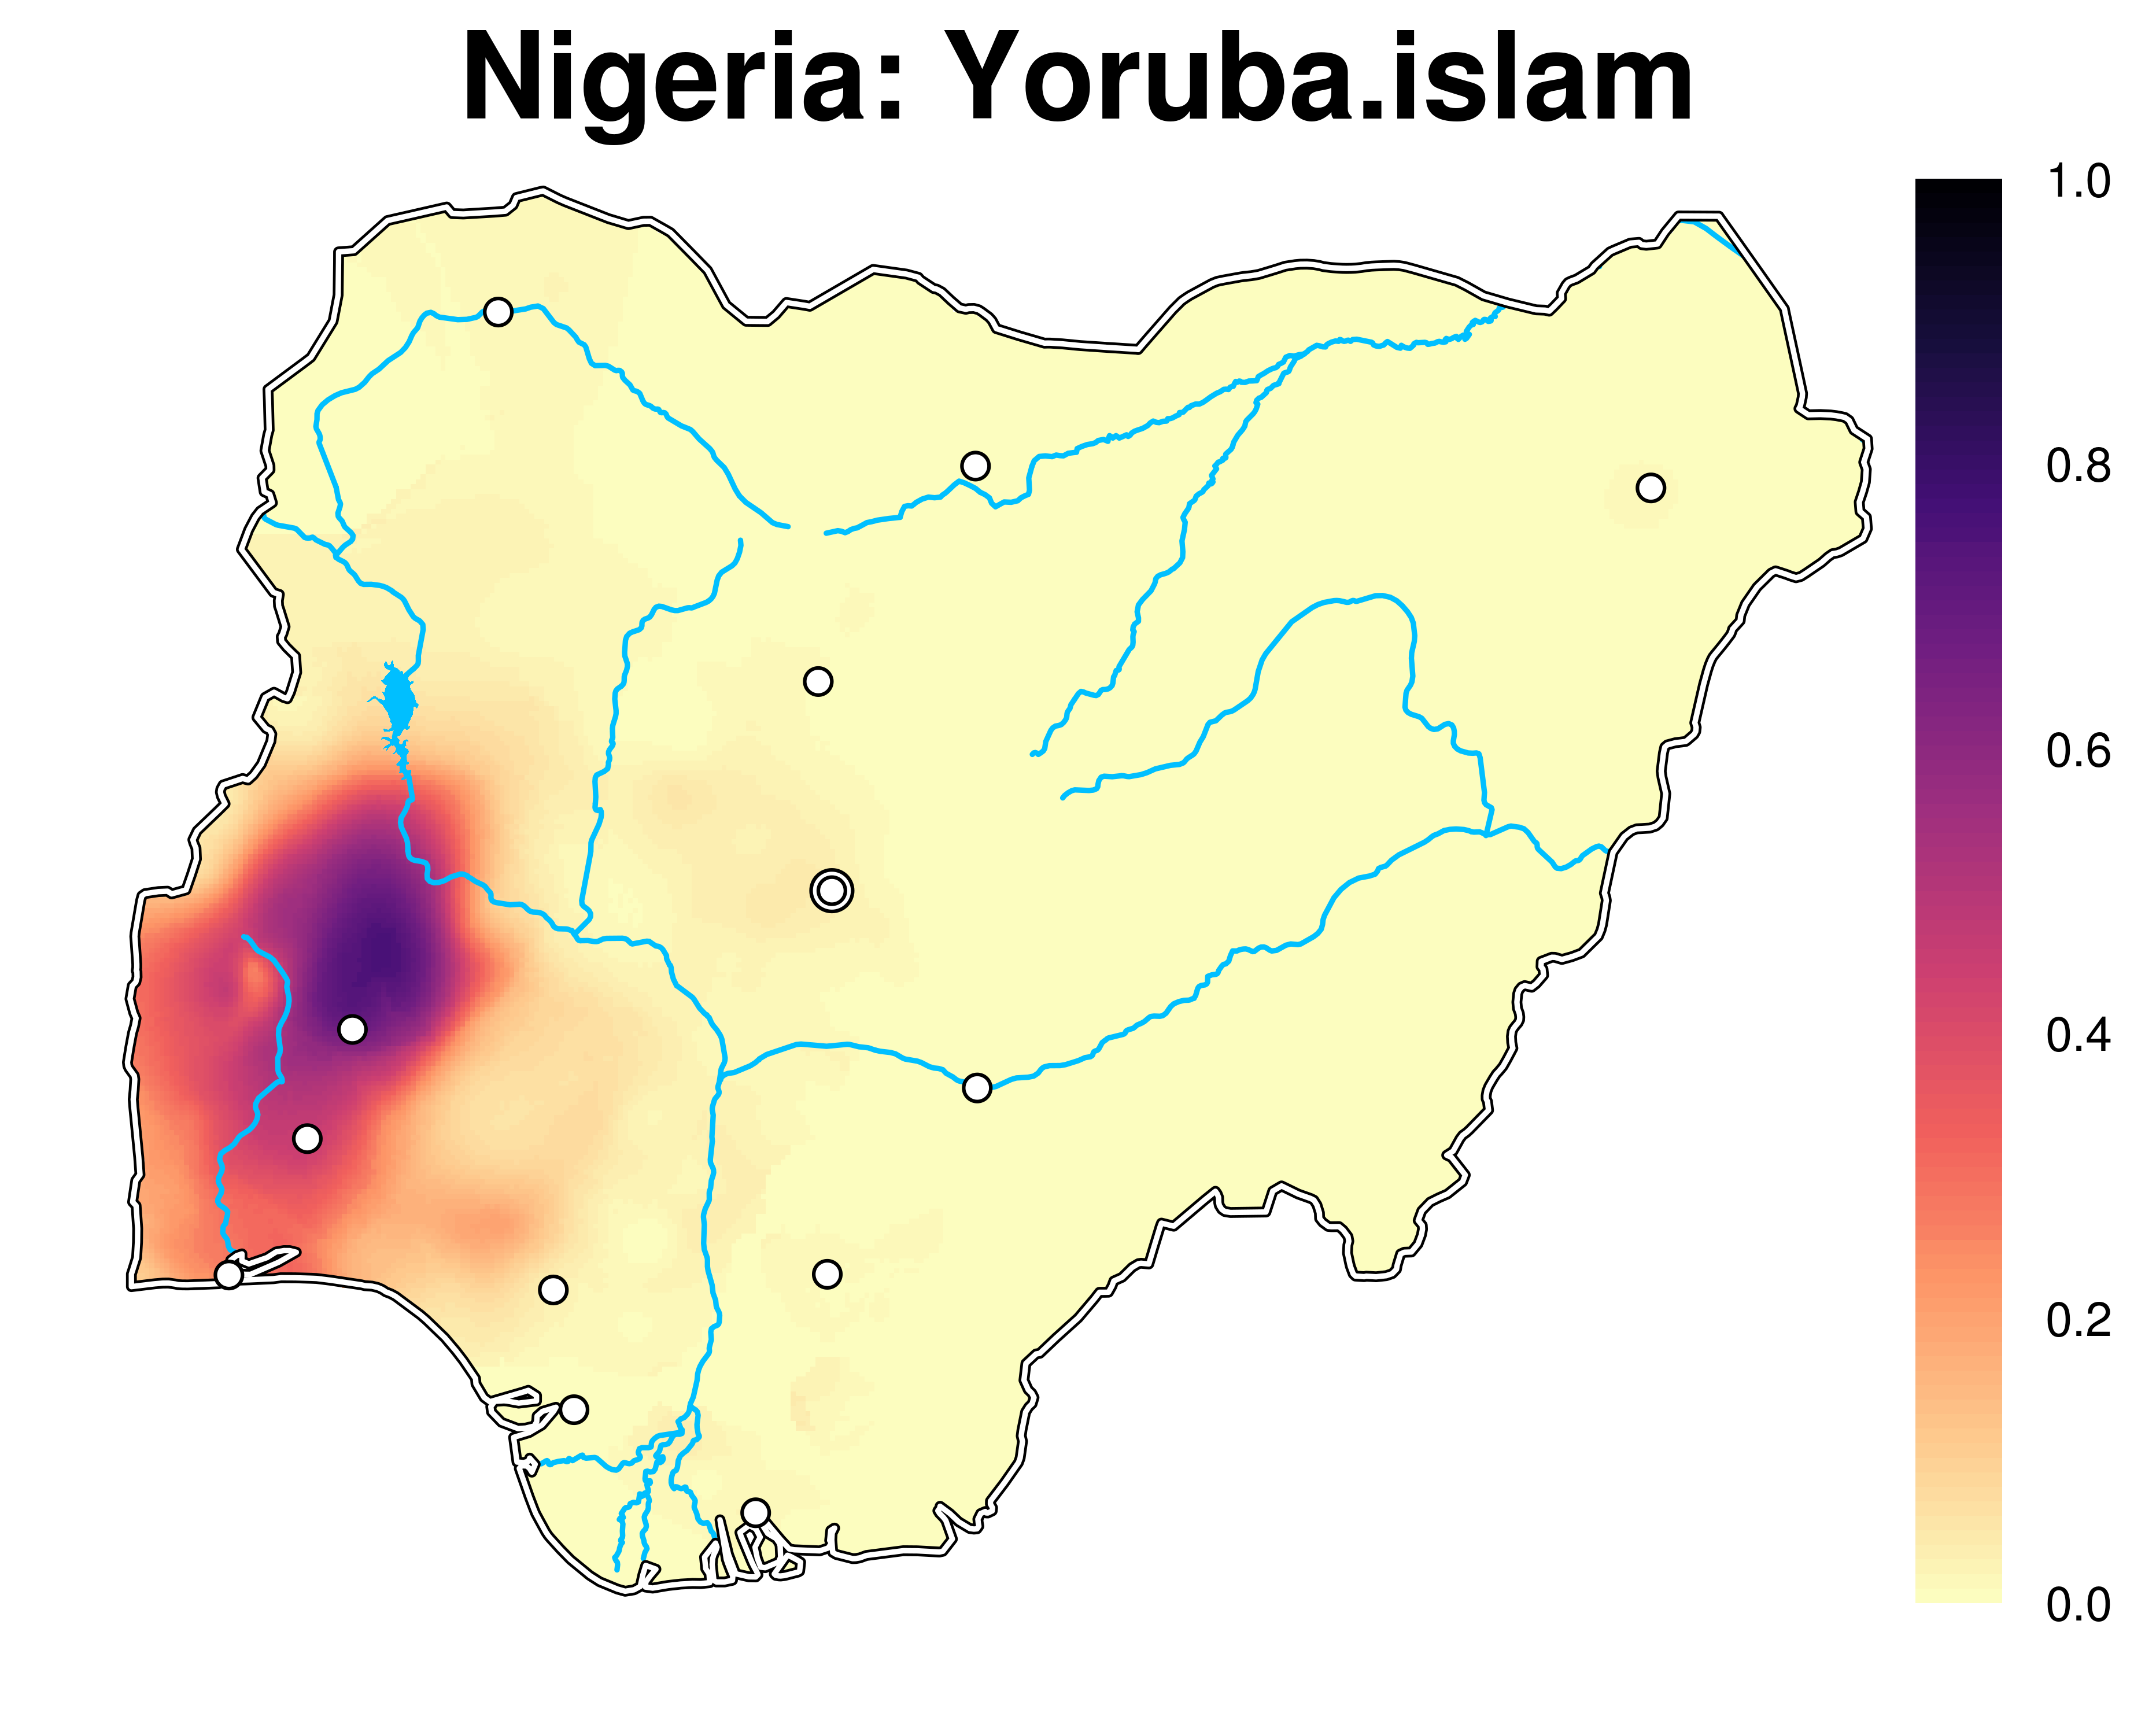
The Spatially Interpolated Data on Ethnicity (SIDE) dataset is a collection of 253 near-continuous maps of local ethno-linguistic, religious, and ethno-religious settlement patterns in 47 low- and middle-income countries. These data are a generalization of ethnicity-related information in the geo-coded Demographic and Health Surveys (DHS). Many DHS surveys are geo-coded, thus providing a set of spatial sampling points containing local ethnic composition estimates. We use methods from geo-statistics and machine learning to estimate the ethnic composition of areas in between these sampling points to produce a continuous map of ethnic compositions for each surveyed country.
Please refer to this article for all details.
Limitations
Please note the following, important limitations of the data. First, DHS sampling may be not always be representative due to social phenomena, such as political violence. Although there is no systematic evidence of this, the data might in some cases be affected by local sampling bias. Second, even though for many countries SIDE covers multiple years, we caution against relying on this temporal variation for inferential purposes. Due to variation in the sampling and coding of the DHS, a substantial share of intertemporal variance in the SIDE data is random noise. Third, although the SIDE data are provided as high-resolution rasters, very local variation in the data may not be meaningful. This depends on the imputation parameters, the local density of the DHS data, and their random displacement of up to 2km (10km) in urban (rural) areas.Given these limitations, we encourage the use of SIDE for cross-national analyses that require consistent, cross-national data on local ethnic demographies, rather than single-country studies that rely on high-precision data.
Citation
When using this dataset in your research, please include the following reference:Müller-Crepon, Carl & Philipp Hunziker. (2018). New Spatial Data on Ethnicity: Introducing SIDE. Journal of Peace Research 55(5), 687–698.
The SIDE data is licensed under a Creative Commons Attribution-Non Commercial (CC-BY-NC) 4.0 International License.
Data
Please select a map to view or download it.
Metadata
The SIDE data comes with its own metadata:Metadata (.csv)
Metadata codebook (.pdf)
Bulk download
To download the entire SIDE Data, you can make use of the R-Package described below. You can also use your own program to loop over the .asc-files to download. Each SIDE map is referenced by a unique ID contained in the metadata. From that, its url is simply constructed as: "https://side.ethz.ch/raw/v1/SIDEID.asc". Note that each map is nested within a particular round of the DHS Survey, a country, and a map type (i.e. ethnic, religous, or ethno-religious). For further details, see also the codebook of the metadata.R Package
This R Package has been developed to facilitate the usage of the SIDE data. It provides easy access to the data and integrates its metadata directly.Installation
library(devtools)
devtools::install_github("carl-mc/sidedata")
Usage
# Load packages
library(sidedata)
library(raster)

# Download SIDE Data for ethnic Groups in Uganda 2010
side_download(country = "Uganda", year = 2010, marker = "ethnic", dest.dir = getwd(), conv.hull = T)
# Load SIDE Data for ethnic groups in Uganda 2010
# ... ethnic map
uga.ethnic <- side_load(country = "Uganda", year = 2010, marker = "ethnic", source.dir = getwd())
plot(uga.ethnic)
# ... get the SIDE meta data for these maps
uga.ethnic.meta.df <- sidemap2data(uga.ethnic)
head(uga.ethnic.meta.df)
names(uga.ethnic) <- uga.ethnic.meta.df$groupname
# ... convex hull of points
uga.convhull <- side_load(country = "Uganda", year = 2010, marker = "ethnic", source.dir = getwd(),
conv.hull = TRUE)
plot(uga.convhull)
# Population-weighted aggregation to some spatial unit

# ... spatial units
#     Adm 1 units from the GADM Database: https://gadm.org/download_country_v3.html
library(sp)
gadm.uga.adm1.url <- "https://biogeo.ucdavis.edu/data/gadm3.6/Rsp/gadm36_UGA_1_sp.rds"
units.shp <- readRDS(gzcon(url(gadm.uga.adm1.url)))
plot(units.shp)

# ... population raster: for demonstration only, assume every raster cell has a random population between 1 and 1000)
##     for real population values:
##     pop.raster <- raster("your.pop.raster.asc")
##     and allign raster thereafter with raster::crop() and raster::resample()
pop.raster <- raster(ext = extent(uga.ethnic), res = res(uga.ethnic))
pop.raster <- setValues(pop.raster, sample(c(1:100), size = ncell(uga.ethnic), replace = T))
plot(pop.raster) ## random population ...

# ... compute group counts
uga.ethnic.counts <- uga.ethnic*pop.raster
names(uga.ethnic.counts) <- names(uga.ethnic)

# ... aggregate to unit level
uga.ethnic.agg <- raster::extract(uga.ethnic.counts, units.shp, fun = sum, na.rm = T)
colnames(uga.ethnic.agg) <- names(uga.ethnic)

# ... convert back to proportions
uga.ethnic.agg <- uga.ethnic.agg / rowSums(uga.ethnic.agg)

# ... plot proportion of Baganda per spatial unit
plot(units.shp,
     col = gray(uga.ethnic.agg[,"baganda"]))